tutorial_en_traffic
This enables you to monitor your servers upload and download statistics in a variety of formats. When you first click on the link it will take you to the Summary tab.
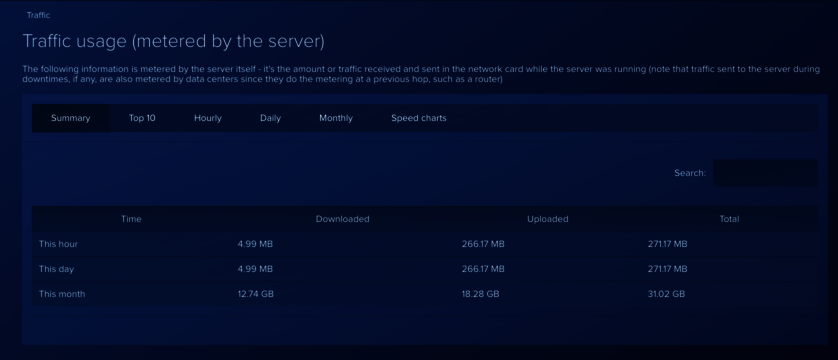
This shows the amount of data uploaded from the server and the amount downloaded to the server in the past Hour, Day and Month.
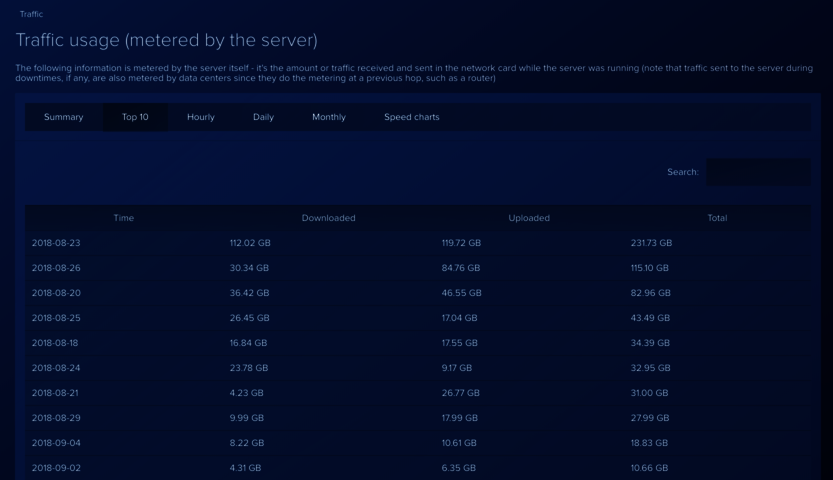
The Top 10 tab lists the daily throughput with the largest total throughput at the top and the least at the bottom.
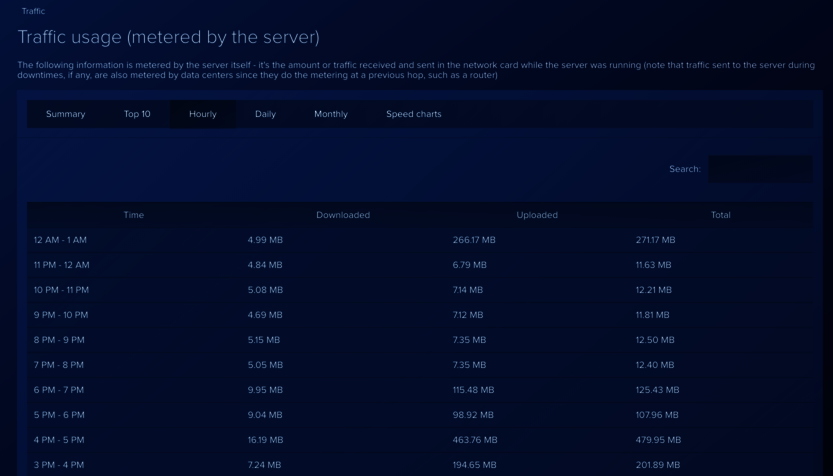
The Hourly tab lists the past 24hrs statistics in an hour by hour chart.
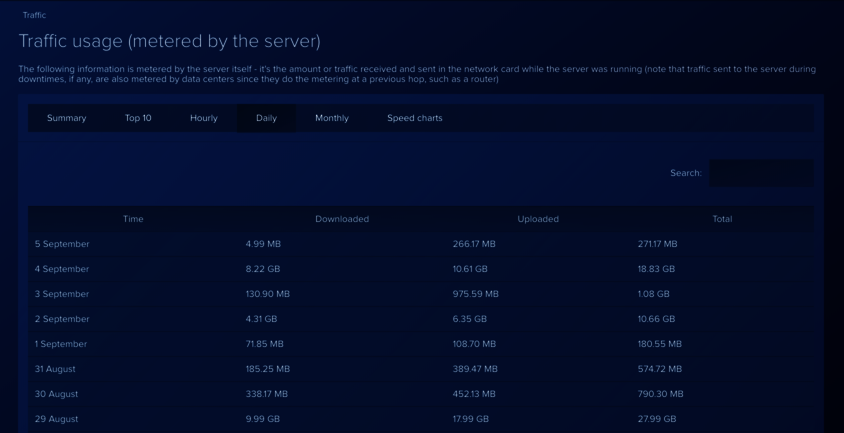
The Daily tab lists the past months statistics in a day by day chart.
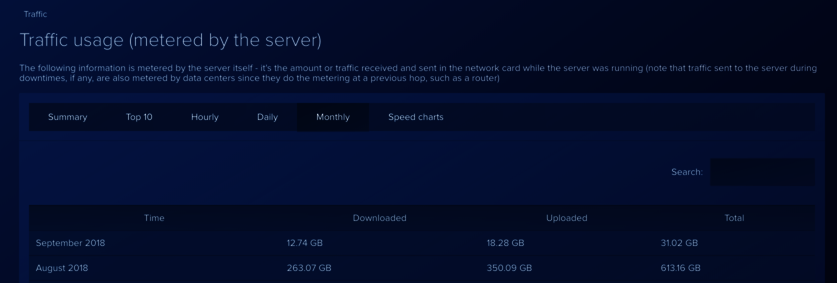
The Monthly tab lists the past years statistics in a month by month chart.
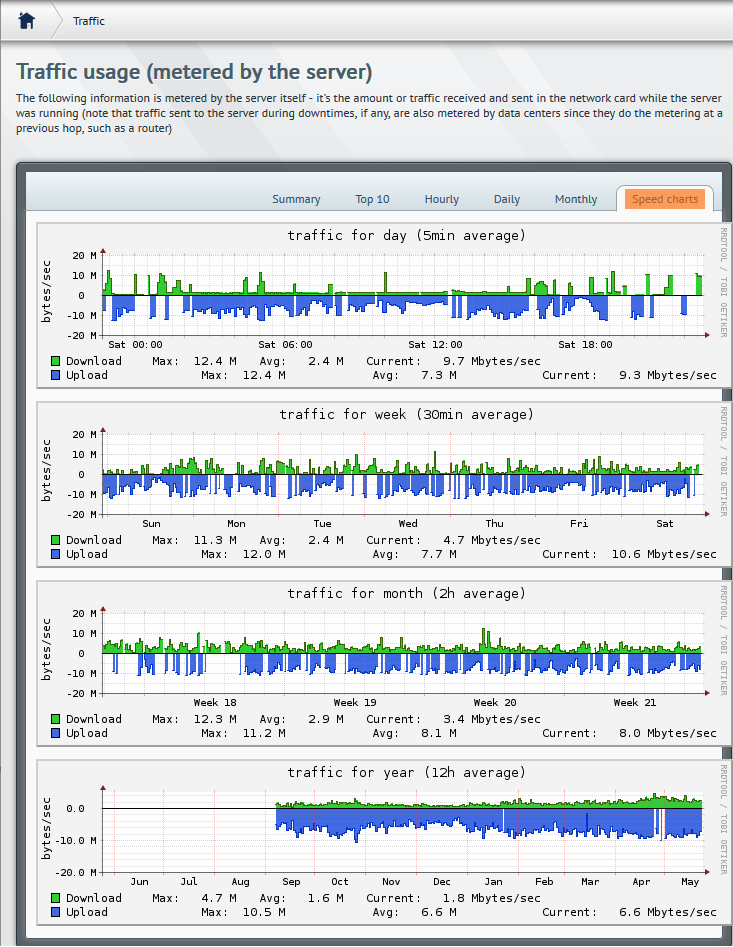
The Speed chart tab displays all this data in a graphical view.
Back
tutorial_en_traffic.txt · Last modified: 2014/05/26 14:15 by h2owegreen

